1
ckm_nodes<-read.csv("ckm_nodes.csv")2
table(ckm_nodes$adoption_date,exclude = NULL)##
## 1 2 3 4 5 6 7 8 9 10 11 12 13 14 15
## 11 9 9 11 11 11 13 7 4 1 5 3 3 4 4
## 16 17 Inf <NA>
## 2 1 16 121The number pf doctors began prescribing tetracycline in each month of the study can be found in the table. 16 are never prescribed. 121 are NAs.
3
test<-ckm_nodes
test$num<-1:246
test<-test[,c(2,14)]
test<-test[!is.na(test$adoption_date),]
x <- vector(mode="numeric")
x<-test$num
x
## [1] 1 2 3 4 5 6 7 8 9 10 11 12 13 14 15 16 17
## [18] 18 19 20 21 22 23 24 25 26 27 28 29 30 31 32 33 34
## [35] 35 36 37 38 39 58 70 72 73 74 75 76 77 78 79 80 81
## [52] 82 91 92 93 94 95 96 97 98 105 108 119 121 122 123 124 125
## [69] 126 127 128 129 130 131 132 133 134 135 136 137 151 152 153 154 155
## [86] 156 168 169 170 171 172 173 174 175 176 177 178 179 180 181 182 195
## [103] 196 197 198 199 200 212 213 214 215 216 217 218 219 220 221 222 223
## [120] 224 225 226 227 229 241cleaned_nodes<-ckm_nodes
cleaned_nodes<-cleaned_nodes[x,]4
adopters<-function (month, not.yet=FALSE) {
  if (not.yet==FALSE) {
    return(as.vector(cleaned_nodes$adoption_date==month))
  } else {
    return(as.vector(cleaned_nodes$adoption_date>month))
  }
}
adopters(2)
## [1] FALSE FALSE FALSE FALSE FALSE FALSE FALSE FALSE FALSE TRUE FALSE
## [12] FALSE TRUE FALSE FALSE FALSE FALSE FALSE FALSE TRUE FALSE FALSE
## [23] FALSE FALSE FALSE FALSE FALSE FALSE FALSE FALSE FALSE FALSE FALSE
## [34] FALSE FALSE FALSE FALSE FALSE FALSE FALSE FALSE FALSE FALSE FALSE
## [45] FALSE FALSE FALSE FALSE FALSE FALSE FALSE FALSE FALSE FALSE FALSE
## [56] TRUE FALSE FALSE FALSE FALSE FALSE FALSE FALSE FALSE FALSE FALSE
## [67] FALSE FALSE FALSE FALSE TRUE FALSE FALSE FALSE TRUE TRUE FALSE
## [78] FALSE FALSE FALSE FALSE FALSE FALSE FALSE FALSE FALSE TRUE FALSE
## [89] FALSE FALSE FALSE FALSE FALSE FALSE FALSE FALSE FALSE FALSE FALSE
## [100] FALSE FALSE FALSE FALSE FALSE FALSE FALSE TRUE FALSE FALSE FALSE
## [111] FALSE FALSE FALSE FALSE FALSE FALSE FALSE FALSE FALSE FALSE FALSE
## [122] FALSE FALSE FALSE FALSEsum(adopters(2))## [1] 9adopters(14,not.yet = TRUE)## [1] FALSE FALSE FALSE FALSE FALSE FALSE TRUE FALSE FALSE FALSE FALSE
## [12] FALSE FALSE TRUE FALSE TRUE TRUE FALSE FALSE FALSE FALSE FALSE
## [23] FALSE FALSE FALSE FALSE FALSE FALSE FALSE TRUE FALSE FALSE FALSE
## [34] FALSE FALSE FALSE FALSE FALSE TRUE FALSE FALSE TRUE FALSE FALSE
## [45] FALSE FALSE FALSE FALSE FALSE TRUE FALSE TRUE FALSE FALSE FALSE
## [56] FALSE FALSE FALSE FALSE FALSE FALSE TRUE FALSE FALSE FALSE FALSE
## [67] TRUE FALSE FALSE FALSE FALSE FALSE FALSE FALSE FALSE FALSE FALSE
## [78] FALSE TRUE FALSE FALSE TRUE FALSE FALSE TRUE FALSE FALSE TRUE
## [89] TRUE FALSE TRUE FALSE FALSE TRUE FALSE TRUE TRUE FALSE FALSE
## [100] FALSE FALSE FALSE FALSE FALSE FALSE FALSE FALSE TRUE TRUE FALSE
## [111] FALSE FALSE FALSE FALSE FALSE FALSE FALSE FALSE FALSE FALSE FALSE
## [122] FALSE FALSE FALSE TRUEsum(adopters(14,not.yet = TRUE))## [1] 235
matrix<-read.table("ckm_network.dat")
clean_network<-matrix[x,x]
6
contact <- vector(mode="numeric")
contact<-apply(clean_network,1,sum)
Part 2
7
(a)
count_peer_pressure<-function(index,month) {
  k<-0
  v<-which(clean_network[index,]==1)
   for (i in v) {
     if (cleaned_nodes$adoption_date[i]<=month) {
       k=k+1
     }
   }
  return(k)
}
count_peer_pressure(37,5)
## [1] 3(b)
prop_peer_pressure<-function(index,month) {
k<-count_peer_pressure(index,month)
  if (k!=0) {
  return(k/length(which(clean_network[index,]==1)))
  } else {return(NaN)}
}
prop_peer_pressure(37,5)
## [1] 0.6prop_peer_pressure(102,14)## [1] NaN8
(a)
app<-function(month){
  vec<-which(adopters(month))
  vec1<-which(adopters(month,not.yet = TRUE))
  k <- vector(mode="numeric",length = length(vec))
  k1 <- vector(mode="numeric",length = length(vec1))
  for (i in 1:length(vec)) {
        k[i]<-prop_peer_pressure(vec[i],month)
  }
  for (i in 1:length(vec1)) {
        k1[i]<-prop_peer_pressure(vec1[i],month)
  }
  return(c(mean(k,na.rm = TRUE), mean(k1,na.rm = TRUE)))
}
(b)
plot1<-matrix(1:17, nrow=17,ncol=1)
plot2<-apply(plot1, 1, function(x) app(x))
plot3<-matrix(plot2, ncol=2,byrow=TRUE)
plot3<-as.data.frame(plot3)
plot3$num<-1:17
plot3$diff<-plot3$V1-plot3$V2
plot(plot3[,1],type = "l", ylab = "Proportion",col=1, main="Proportions in/after the month")
lines(plot3[,2],col=2)
legend("bottomright",c("in the month","after the month"),col=c(1,2),lwd=1)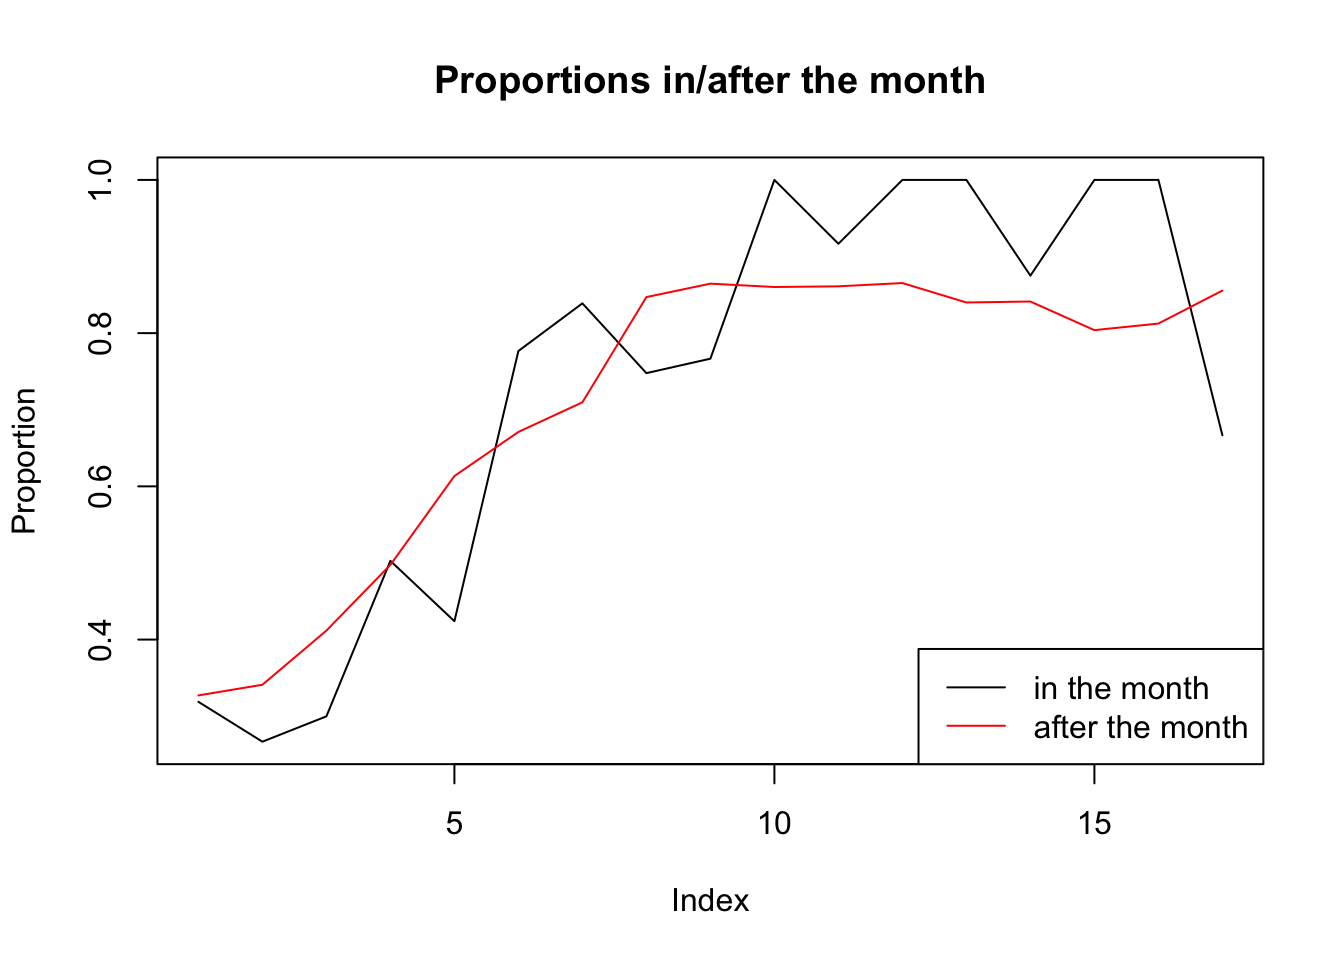
plot(plot3[,4],type="l", ylab = "Proportion", main = "Difference Plot")
abline(h=0)
The curve in the “Difference Plot” centers around the 0 line, which means the doctors who adopt in a given month do not consistently have more contacts who are already prescribing than the non-adopters.